


Business users must recognize the relationship between records in today’s commercial environment. Therefore, Power BI’s new illustration feature in Yana Automotive Solution allows data visualization. Every car dealer benefits from the interaction with quick, auto-generated reports.
What are the benefits of using the Power BI illustration feature for data visualization?
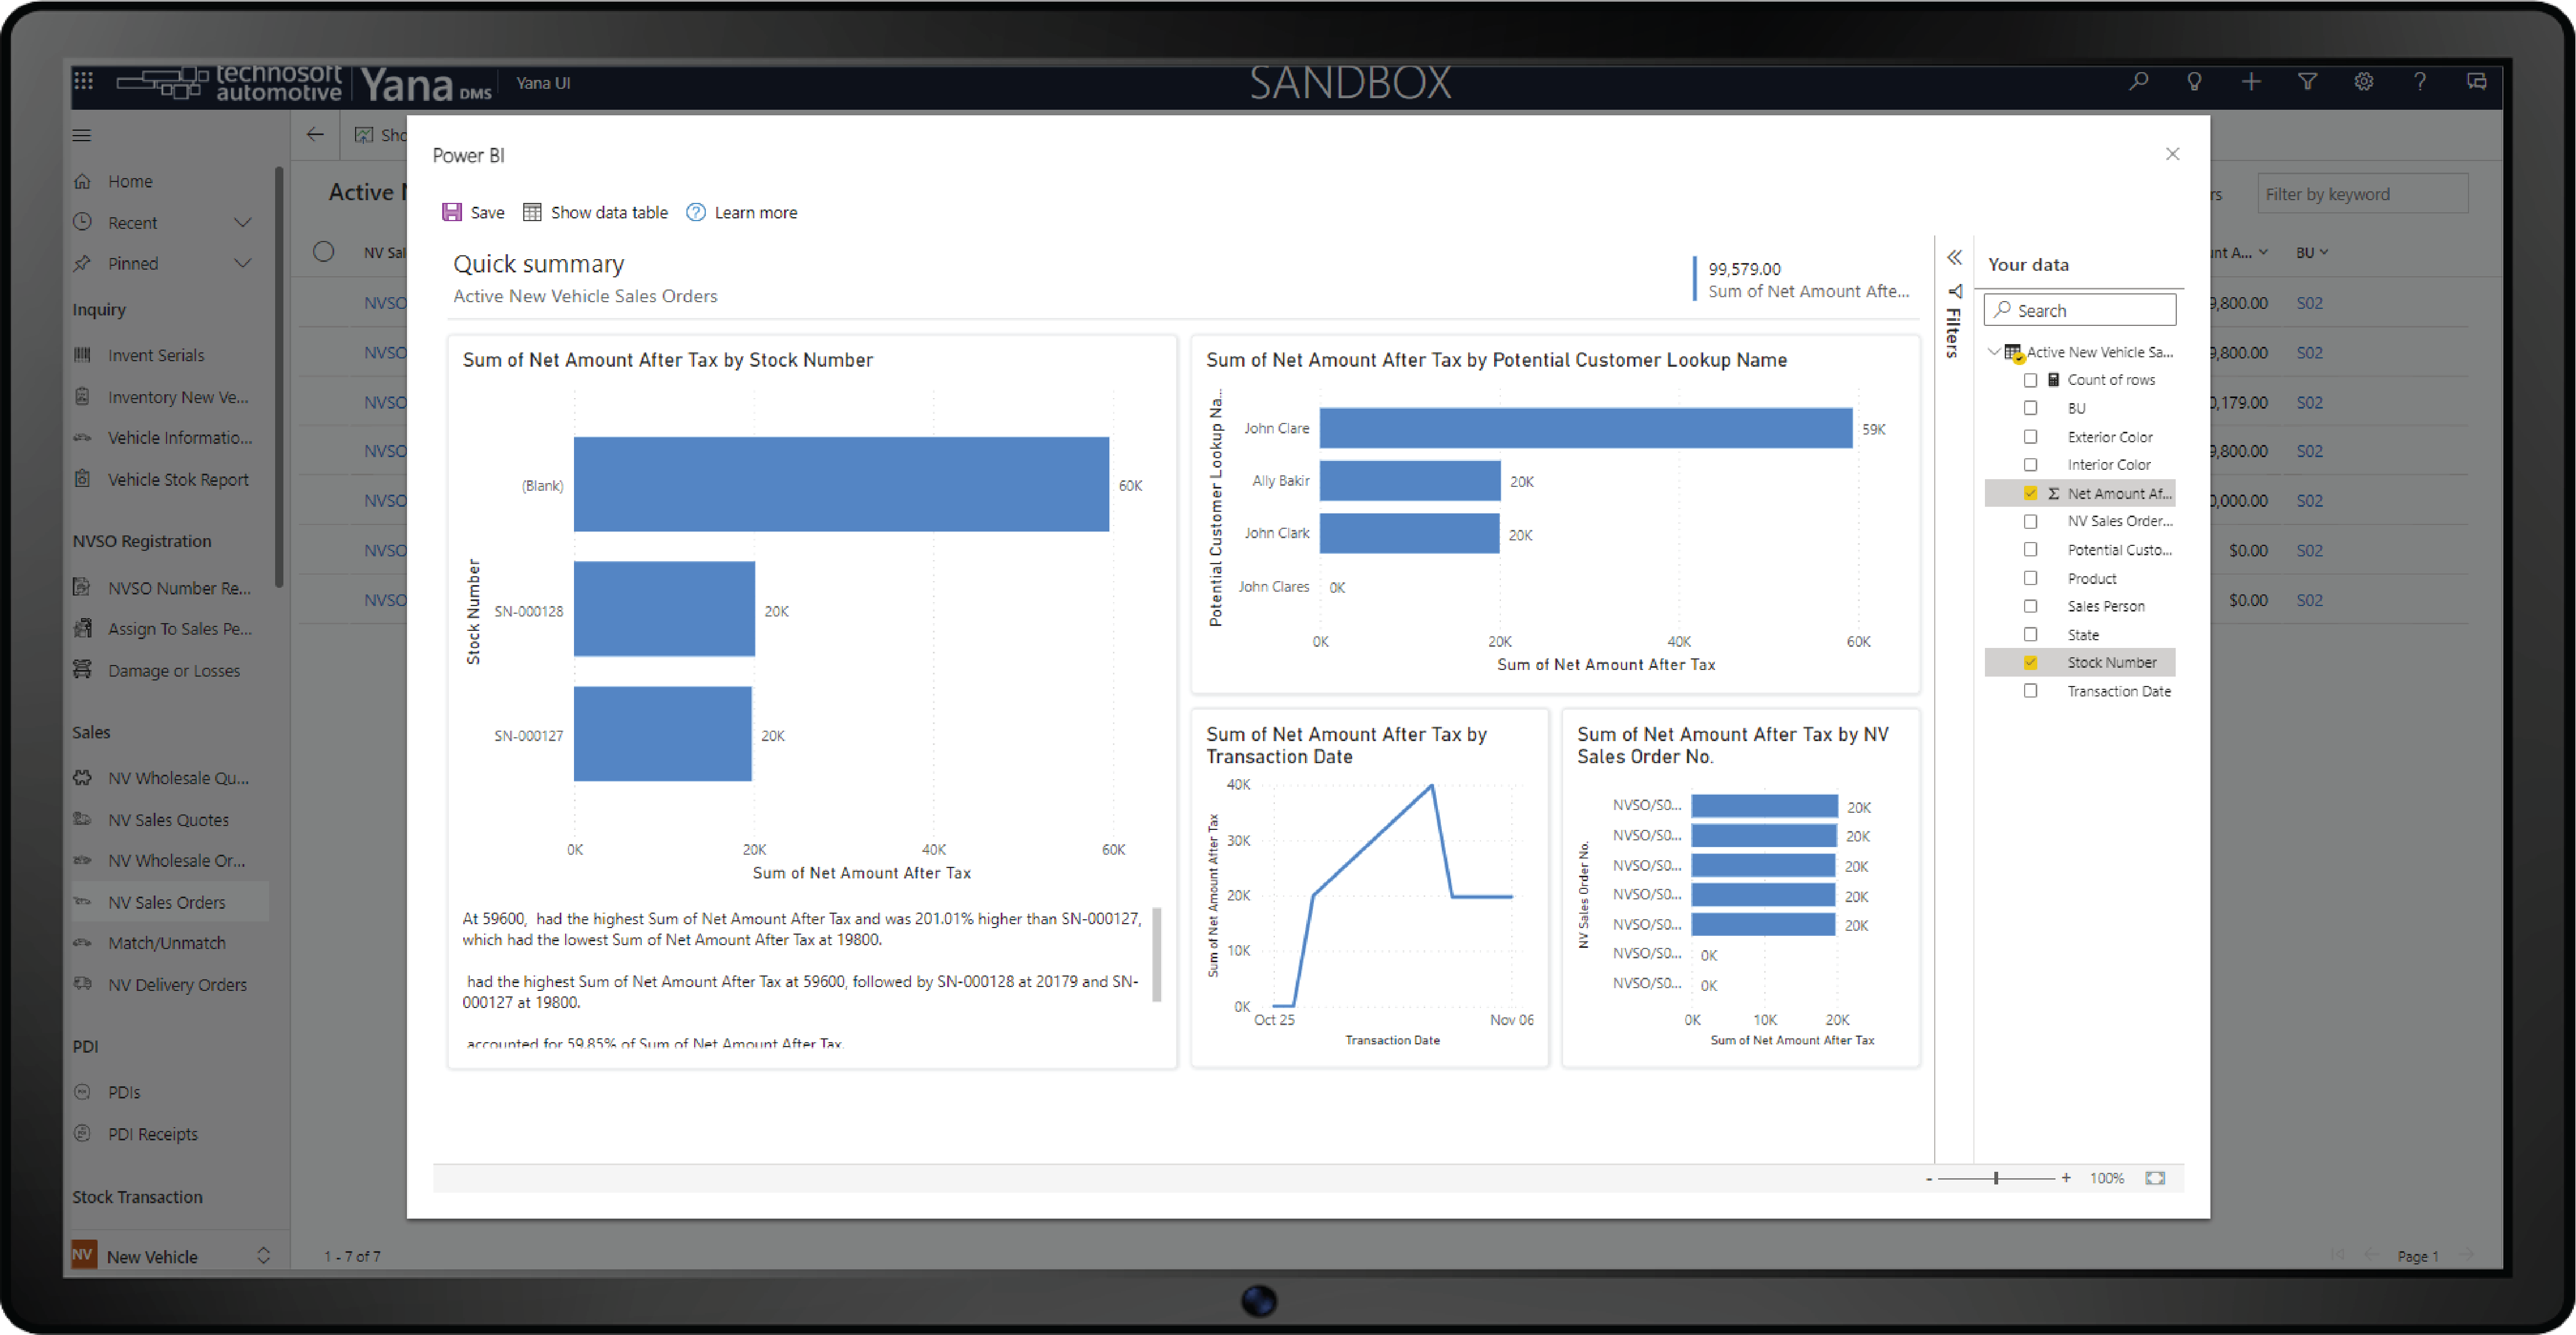
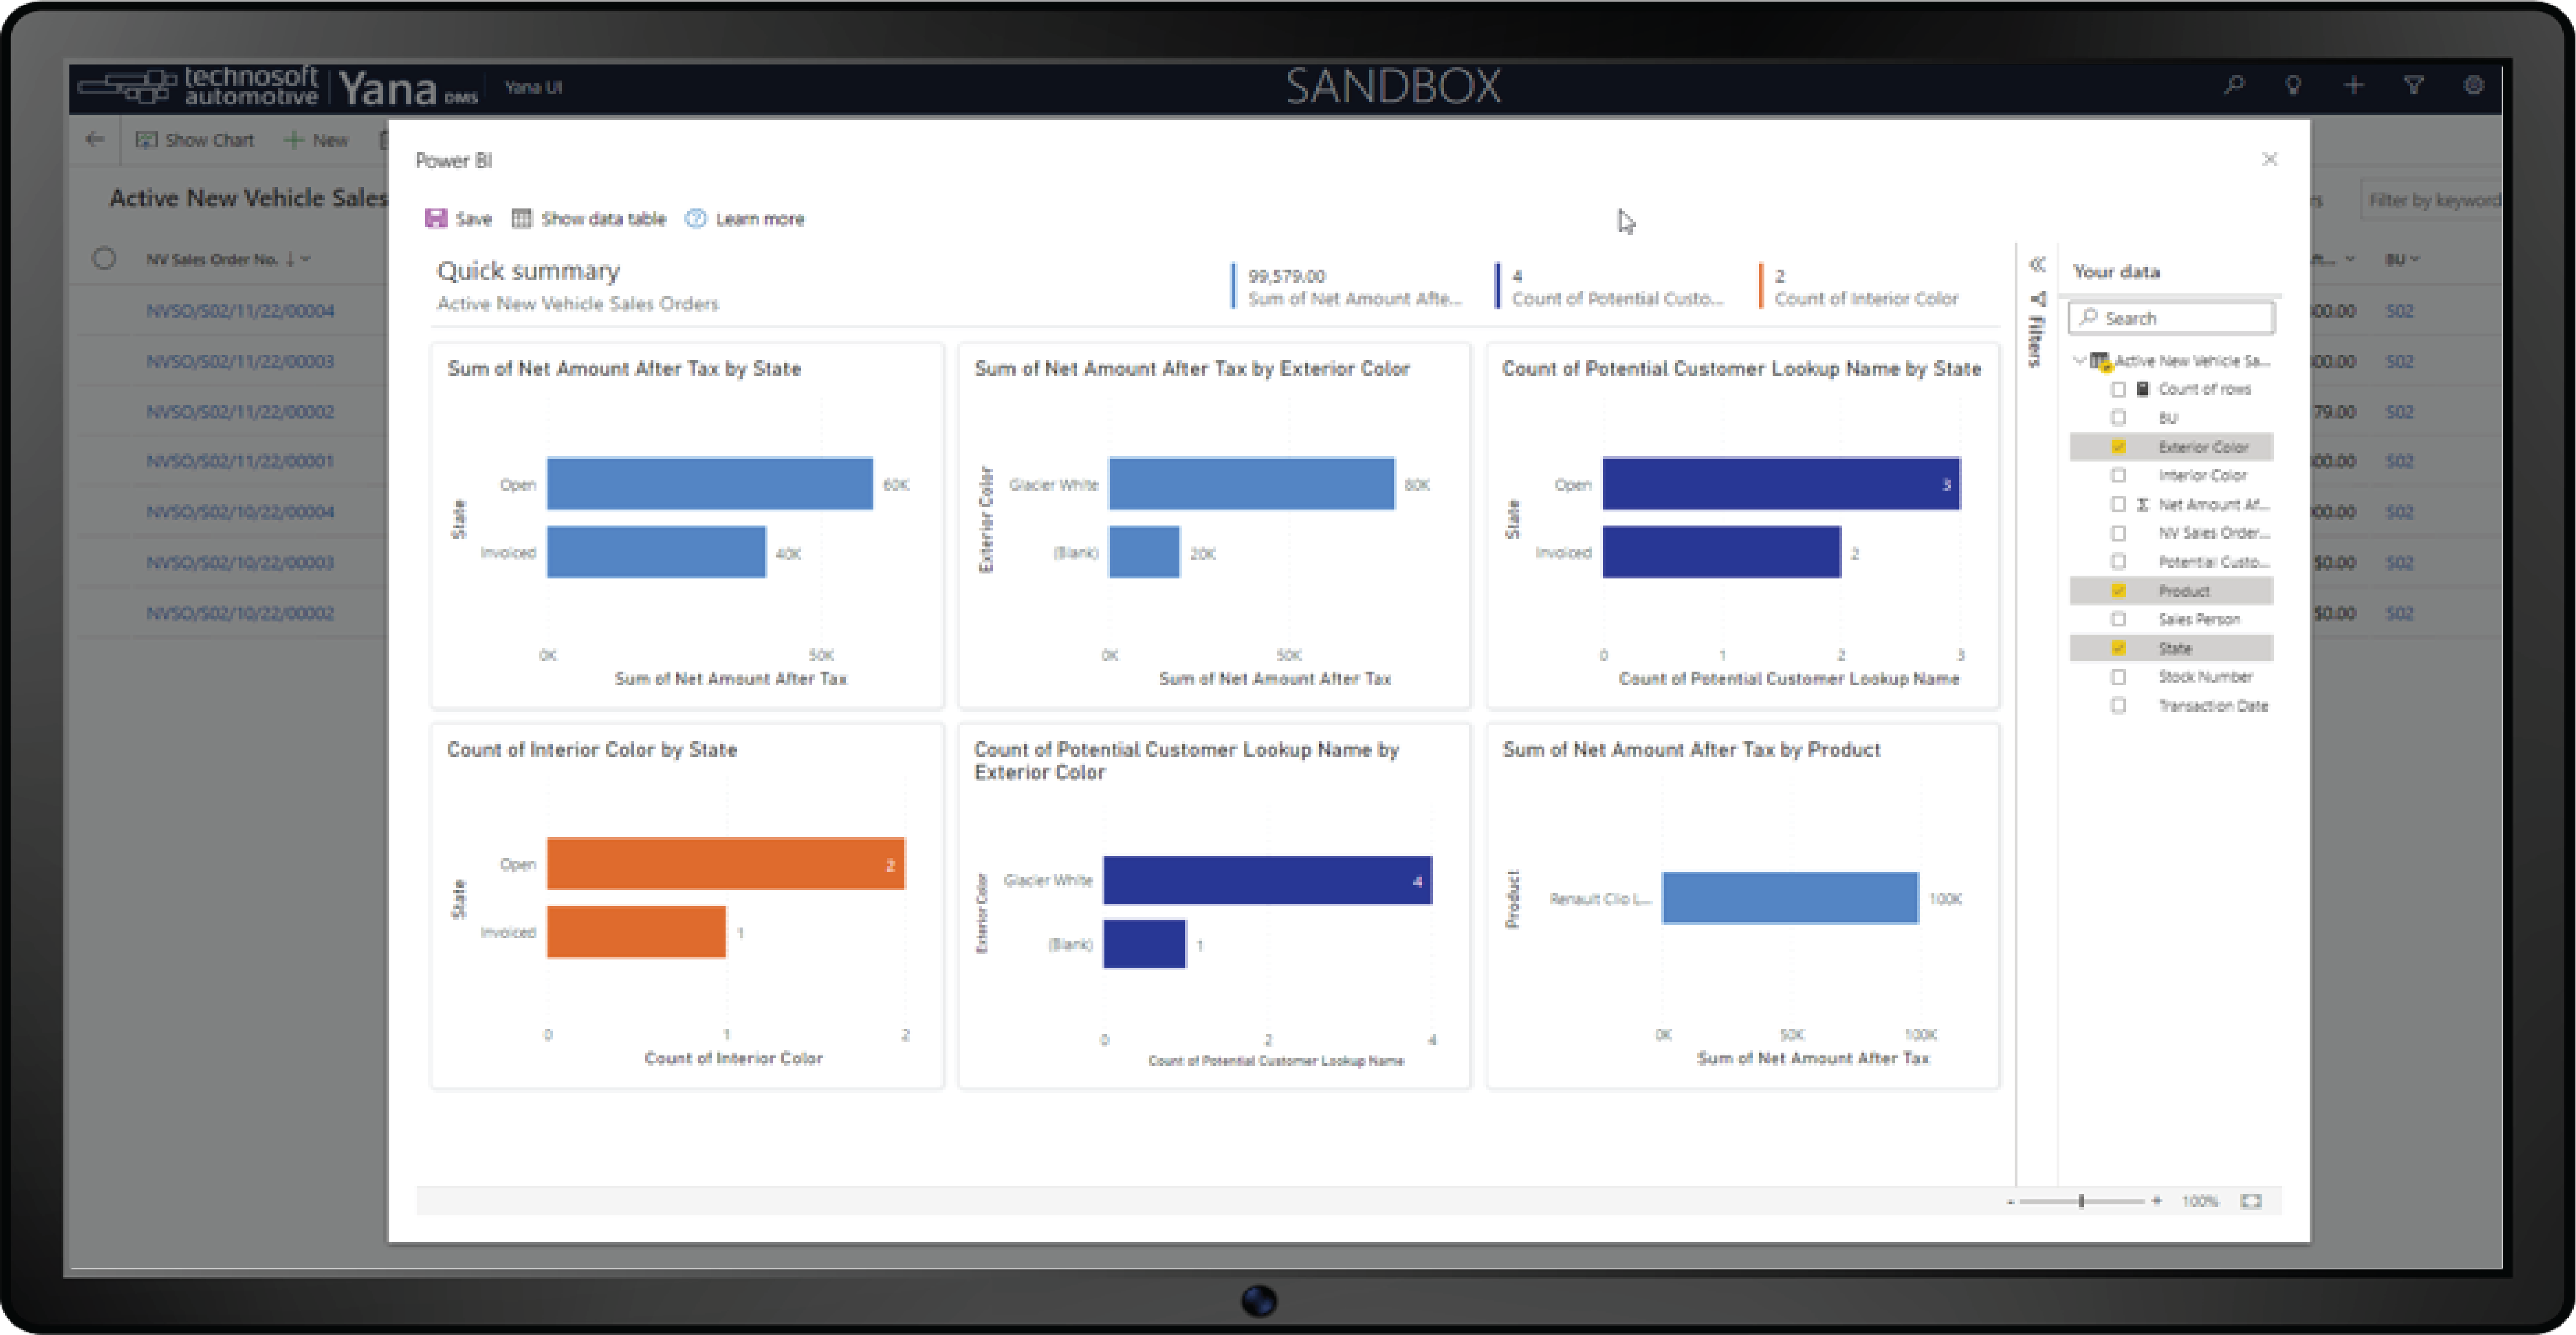
You can use these quick reports to explore your data or as a starting point to create a custom report. The product highlight is to simplify the interaction between reports, empowering users to analyze their data. For example, sales representatives, service advisors, or marketing managers can see their data differently.
Every visual in the report will utilize one or more fields from the Your Data pane and other unselected areas that produce exciting visuals.
The visual generation algorithm will rerun when loading your report, allowing you to see new visuals even with the same selected fields. Cross-highlighting is also part of the product highlights, enabling you to modify filters on a single visual in the Filters pane. Nevertheless, you can’t add new filters, pages, or report-level.
If the report you’re visualizing is based on a single table, select Show Data Table to reload the report. Users will see both visuals and data in a table at the bottom.
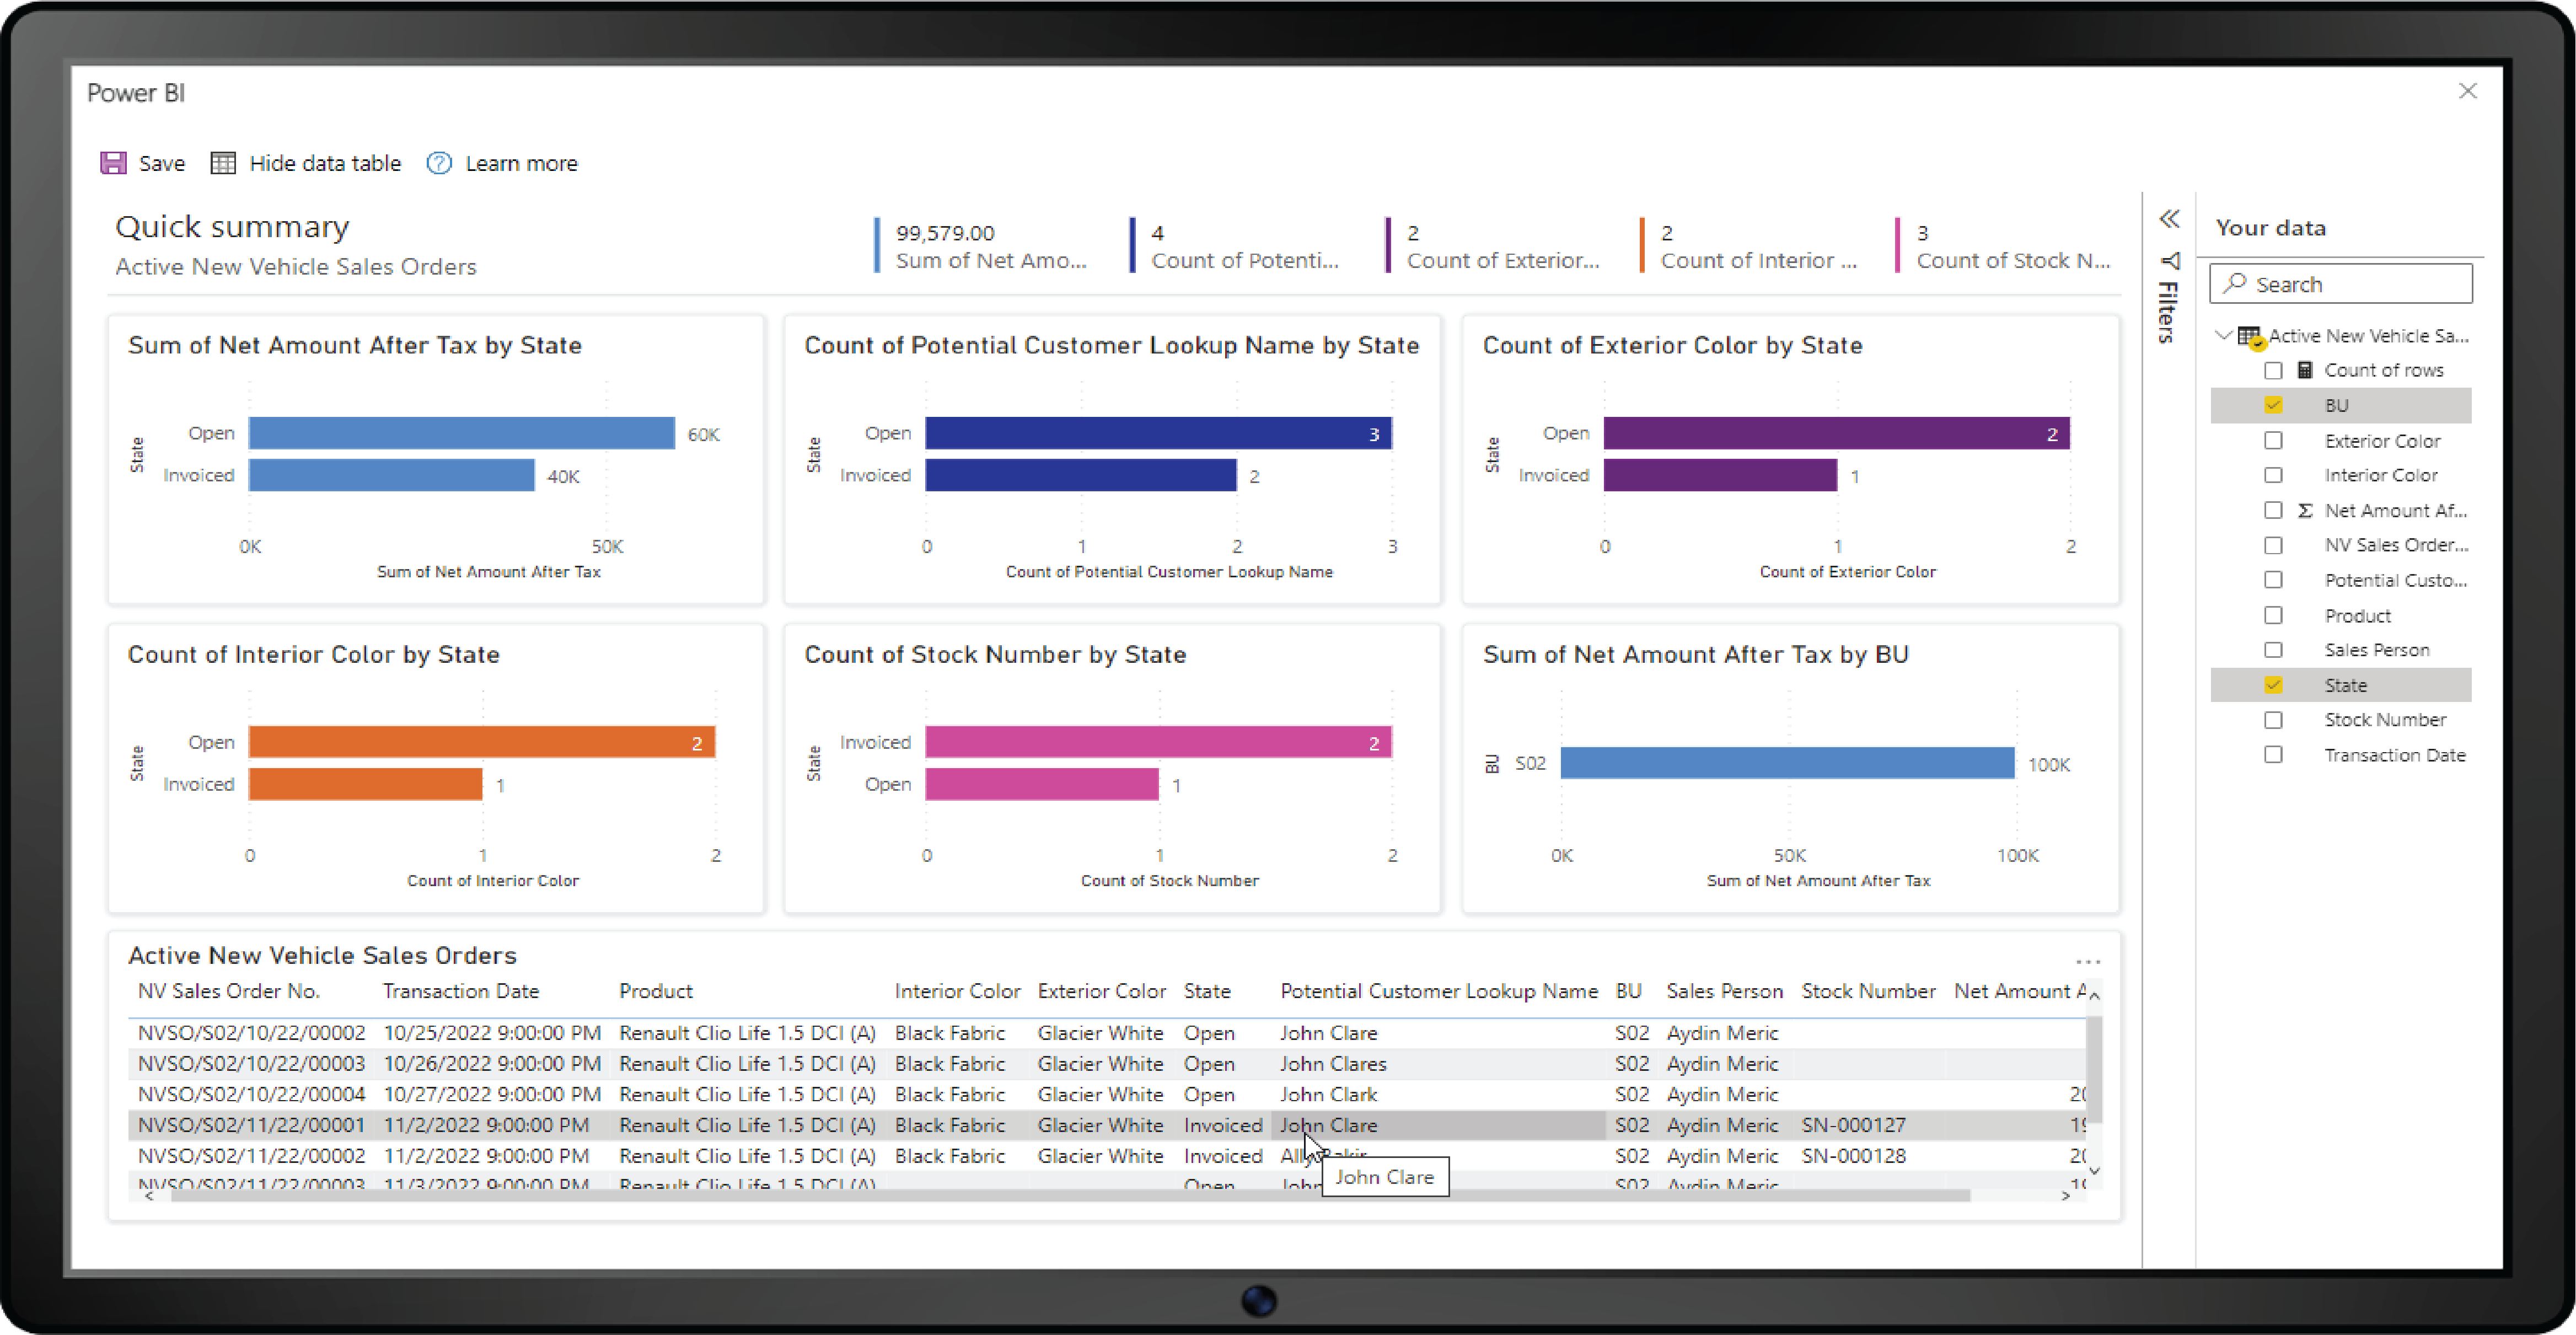
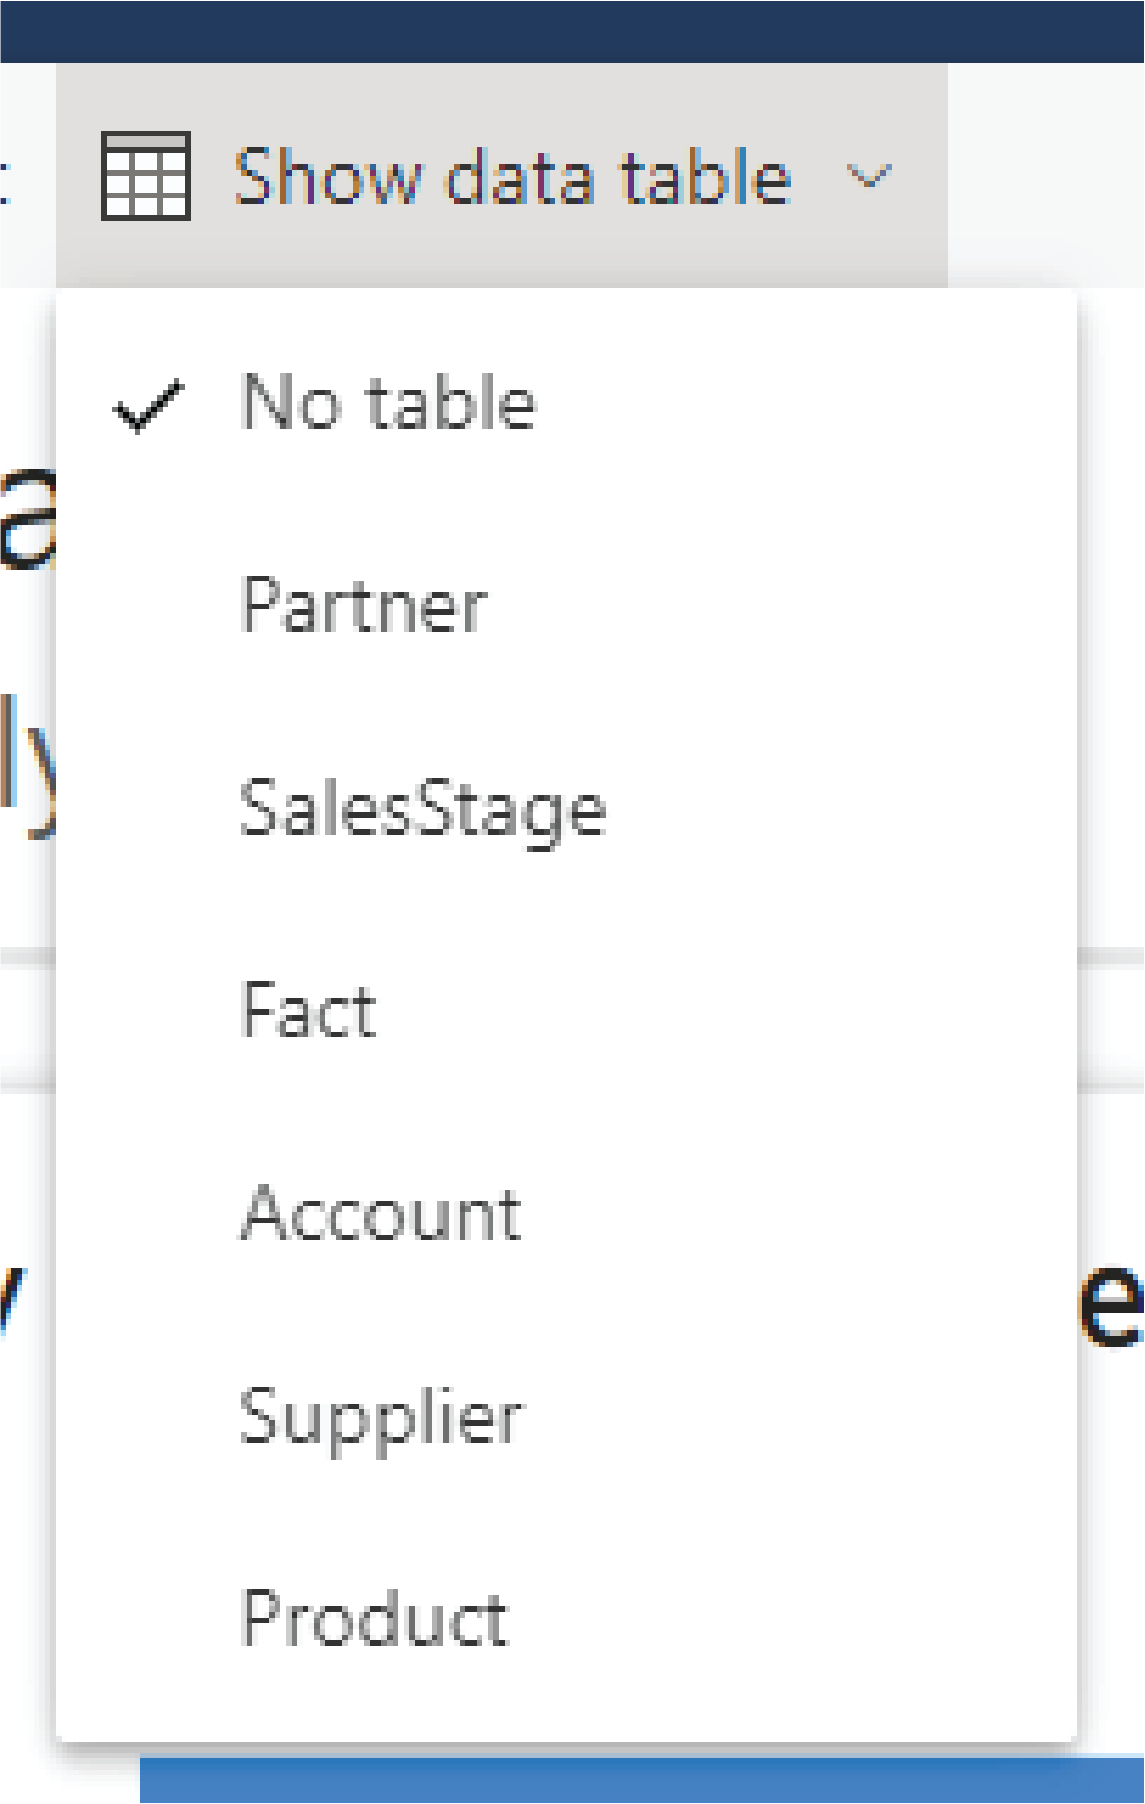
If the report you’re visualizing is based on a dataset with multiple tables, the Show Data Table button becomes a dropdown menu where you can choose the type of table you desire to view.
Additionally, you can perform essential modifications to your auto-generated report. Firstly, by changing selected fields in the Your Data pane, you can signal Power BI about your interest. Subsequently, when you add or remove a field, it automatically generates visuals, including all visuals from the initially created report.
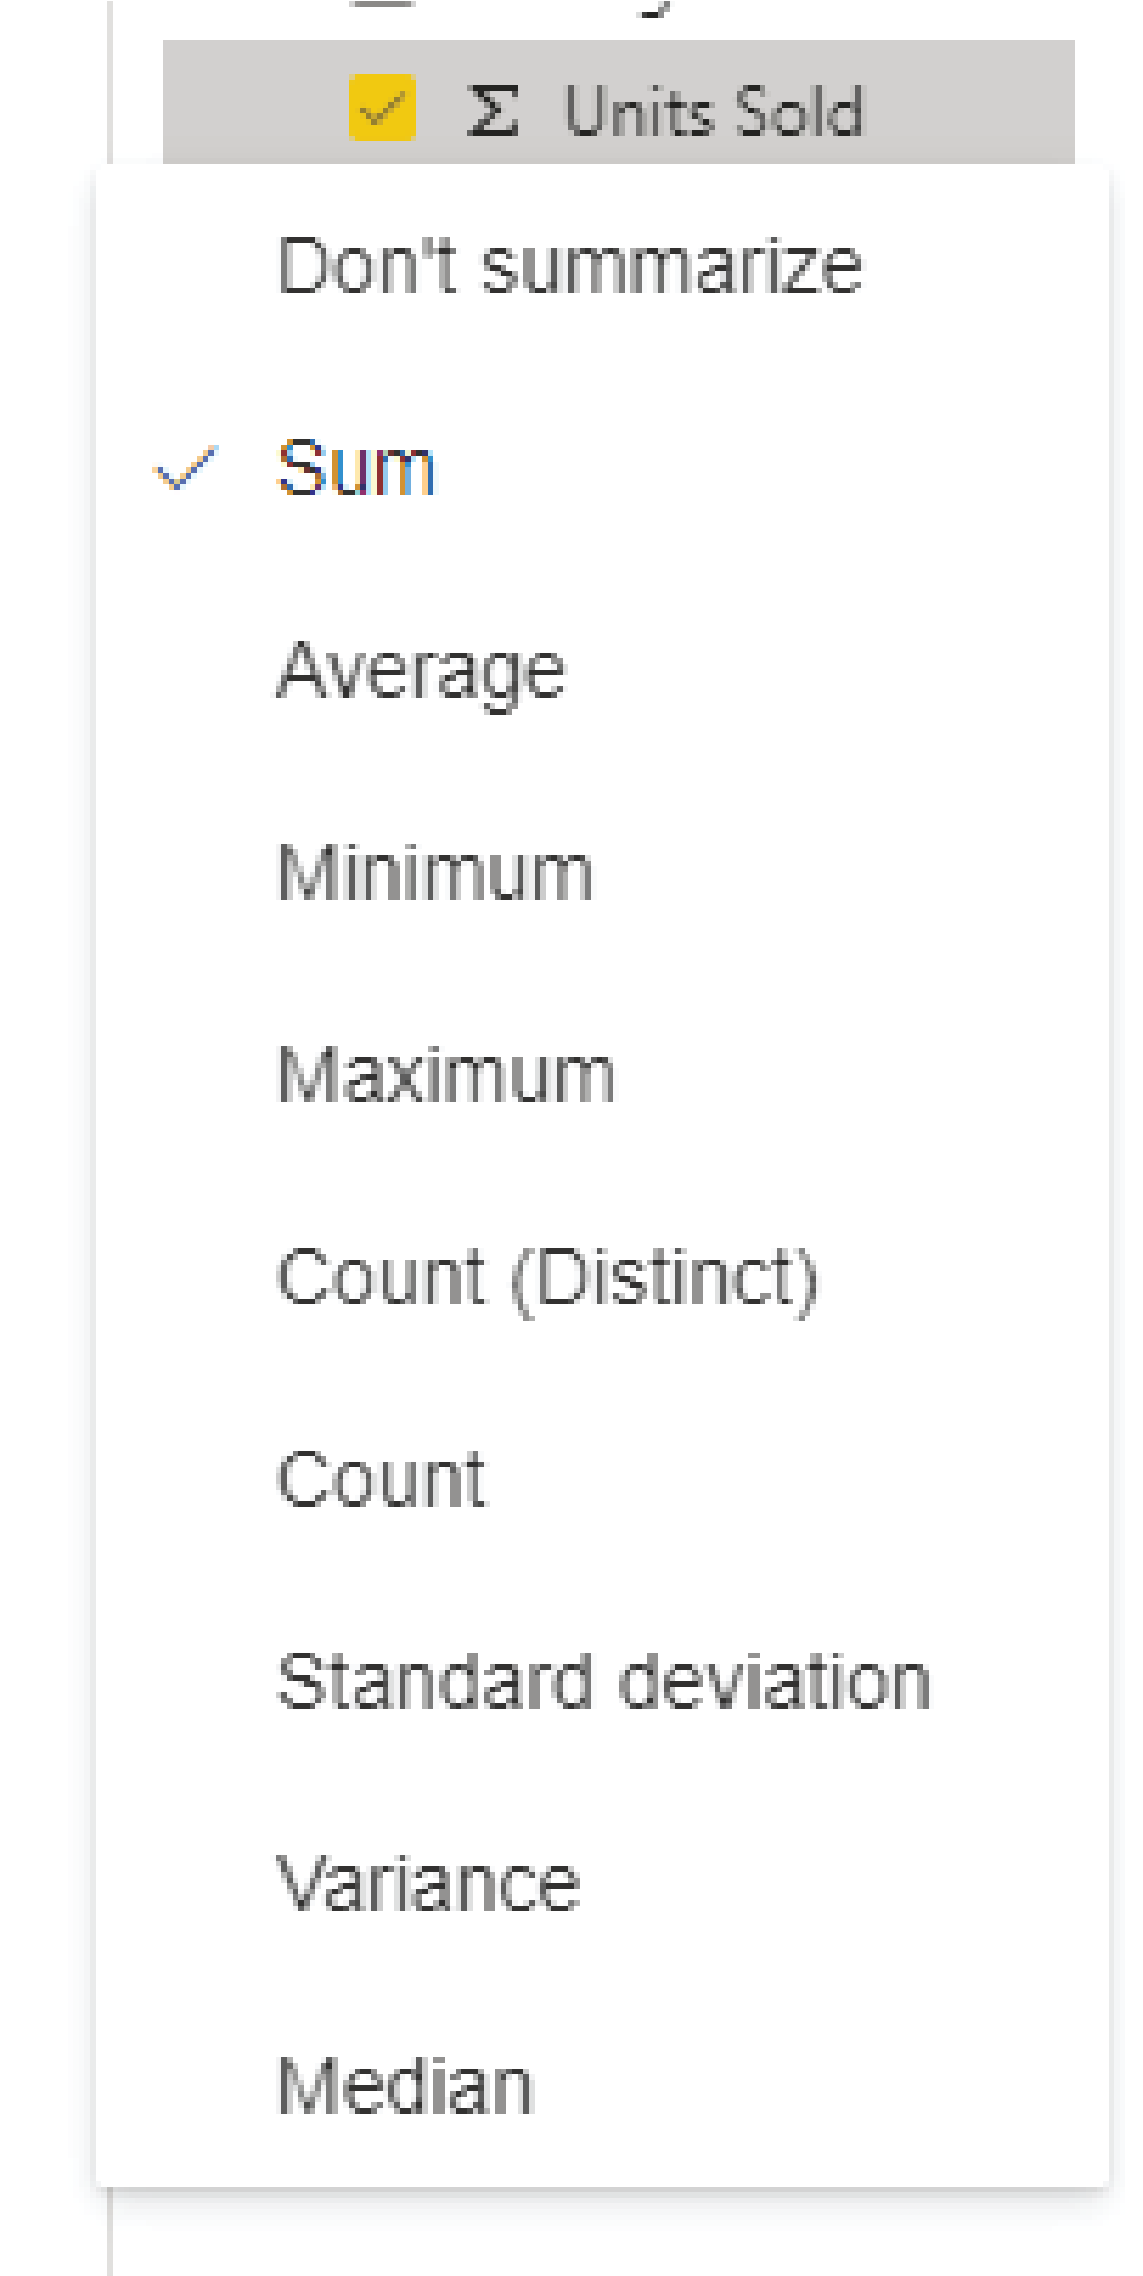
Next, use the right-click context menu in Your Data to adjust how fields are aggregated in the report by switching between Sum, Average, Count, and more.
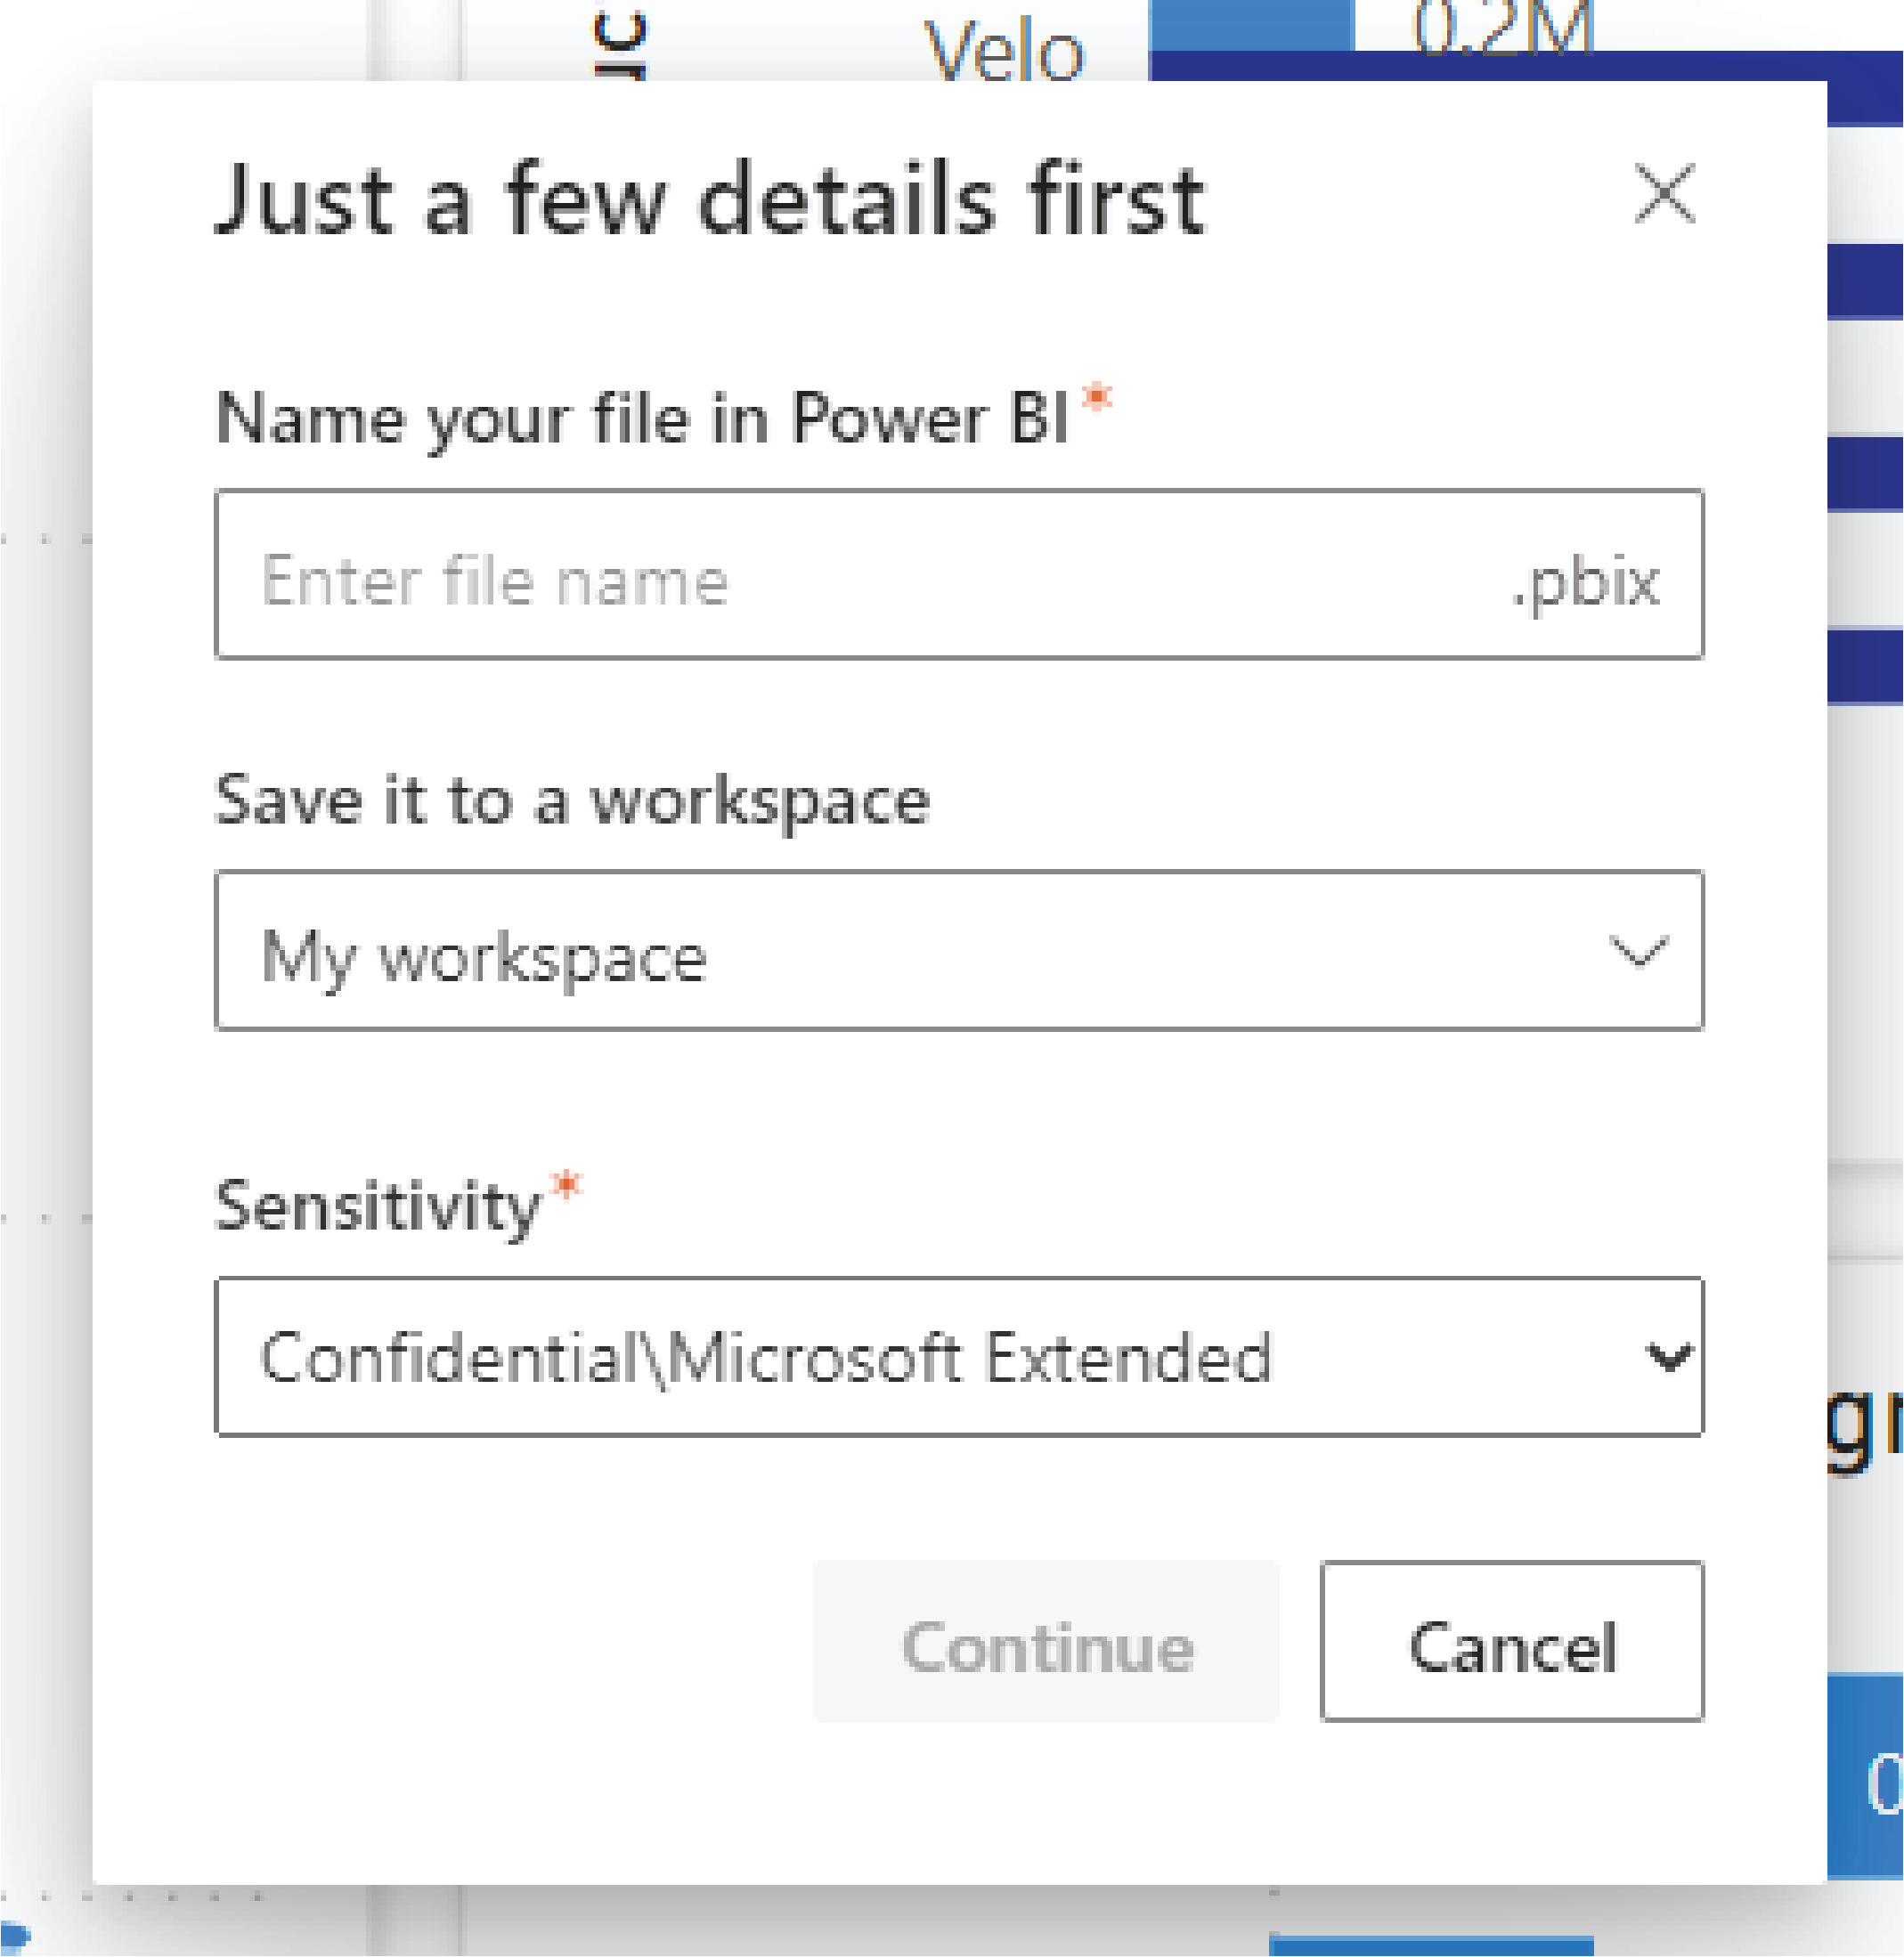
You can name the report when saving your report. Select a workspace to save. Assign it with a Sensitivity Label if required by your organization. You can save to any workspace that contains a Contributor, Member, or Admin role assigned. Alternatively, you can save to your personal My Workspace under a free Power BI license.
After saving this report, it becomes a standard Power BI report. You can share it, package it in an app, subscribe to email updates, or download the .pbix to create further modifications.
Find Out More!
If you want to learn more about Yana Automotive Solution, contact us at marketing@technosoftautomotive.com or schedule a product demo today.